
Crypto Forecast & Analysis Pro vVARY
Crying Cupcake Games


About this app
Developer Description
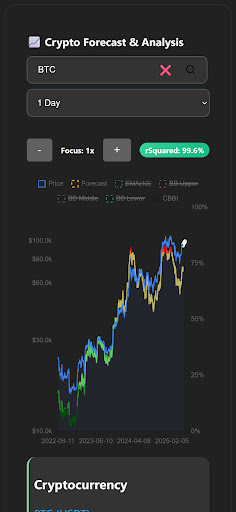
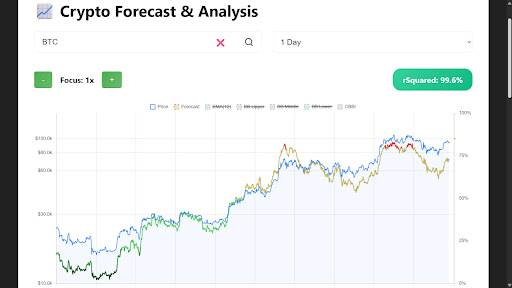
Crypto Charts: Technical Indicators & Price Forecast.
Track and analyze market trends for hundreds of USDT pairs.
Whether you're a seasoned trader or just starting out, Crypto Forecast & Analysis provides the essential tools you need.
The Pro version is also ad-free.
Key Features:
📈 Technical Indicators
Visualize market momentum and volatility with essential indicators, including:
Exponential Moving Average (EMA)
Bollinger Bands (BB)
🔮 Price Forecasting
Explore potential price movements with our forecasting model.
📊 Up-to-Date Data
Access up-to-date price action and historical data for a vast selection of cryptocurrencies.
⚙️ Highly Customizable
Multiple Time Intervals: Switch seamlessly between intervals (1m, 5m, 15m, 1h, 1d, etc.).
Zoomable Charts: Use the 'Focus' control to zoom in on recent price action or view long-term trends.
Auto-Refresh: Keep your data fresh with configurable auto-refresh intervals.
📱 Clean & Responsive Interface
Designed for easy navigation and clear data visualization on mobile devices.
Why Choose Crypto Forecast & Analysis?
Analyze Trends: Identify patterns and potential opportunities using robust charting and indicators.
Explore Possibilities: Utilize the forecast engine as one tool in your analysis toolkit (not financial advice).
Download Crypto Forecast & Analysis today and elevate your cryptocurrency market analysis!
Disclaimer: Cryptocurrency trading involves significant risk. Forecasts are based on historical data and models, not guarantees of future performance. This app is an analysis tool and does not provide financial advice. Always do your own research before making any investment decisions.
Version Information
- Version
- -
- Downloads
- 0+
- Updated on
- -
- Released
- May 7, 2025
- Requires
- Android Varies with device
Statistics
Google Play Rating History
Rating Distribution
Downloads Over Time
Crypto Forecast & Analysis Pro has been downloaded times. Over the past 30 days, it averaged downloads per day.
Shaded area shows 30-day prediction based on historical trends
Historical data collection started recently. More data points will be available over time.
ApkTrusted Ratings & Reviews
More from Crying Cupcake Games
See more apps


Scan this QR code to download

Forwarding you to the page at Google Play market in seconds...
Open Google Play market now