
Bluetooth Terminal/Graphics v2.06
Emrecan ÇETİN


About this app
Developer Description
This is a kind of Bluetooth Terminal application that contains some graphics.
Also there is a serial monitor in it.
You can use this app with Arduino or another microcontroller for your robotics projects and etc.
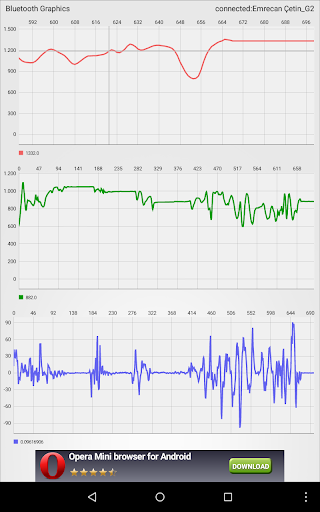
You can see real time 3 graphics of some values.
This values must be sent in a sequence.
This sequence must be like that: Evalue1,value2,value3...\n
For example: "E256,-321,982\n" or "E902,1235,10,23,-325,-1240,90\n" etc.
***In Full version, you can see 7 graphs and there are no ads***
Warning: Do not send data too much frequently. If there is lag and freezing in the app when there is data traffic, decrease incoming data frequency.
*This application supports up to 7 variables.
*You can set graphics' maximum and minimum values.
*Autoscaled graphs.
*Values are ordered in the order of sending in application.
*Each graph can show a value that is selected.
*You can set number of graphics that is shown.
*Multiple lines can be shown in a graph.
*Pinch to zoom both axes in graphs.
*Sliding and refreshing graphs.
*Data logs can be saved at *ExternalStorage*/BluetoothGraphics/*CurrentTime* directory
*Up to 7 lines in multiple line graph for Full version
MPAndroidChart library is used.
Arduino usage example for serial printing part for 2 values (adc1 and adc2 are example variables):
...
Serial.print("E");
Serial.print(adc1);
Serial.print(",");
Serial.print(adc2);
Serial.print("\n");
...
Coming Soon: USB Serial Communication Support for Full version
For full application: BT Terminal/Graphics Full
Note: If you want a full apk of this application, you can send mail to me. Also, I can make a custom GUI for your projects or works.
What's New
Version Information
- Version
- 2.06
- Downloads
- 10K+
- Updated on
- Sep 23, 2020
- Released
- Aug 11, 2013
- Requires
- Android 4.1
Statistics
Google Play Rating History
Rating Distribution
Downloads Over Time
Bluetooth Terminal/Graphics has been downloaded times. Over the past 30 days, it averaged downloads per day.
Shaded area shows 30-day prediction based on historical trends
Historical data collection started recently. More data points will be available over time.
Bluetooth Terminal/Graphics users say on Google Play
 A Google user
Hi there, i have the same problem as Muaz Muttalib, i can't get the data to be represented in the chart, however in the terminal it appears properly. I am also using a xiaomi Mi3. The data i receive is ranged from 0-5 or 0-1023. Integers or floats. If you could help it would be nice! Thanks for this app, it is really useful!
 Umbar Basuki
Hii, its working good, but I can not save the logger. Its show error " Directory failed", any body can help?
A Google user
As with others below everything seems to be working except the graph is not displayed on my Nexus 5 running 5.1. Terminal works fine. This is a shame - would otherwise be perfect for my project.
 Abdellouahed Cheji
Graph not working.
 Bence Vörös
The app starts with an ad and after that it closes itself.
ApkTrusted Ratings & Reviews
More from Emrecan ÇETİN
See more apps


Scan this QR code to download

Forwarding you to the page at Google Play market in seconds...
Open Google Play market now