
Professional Stock Chart v3.7.23
prostockchart.com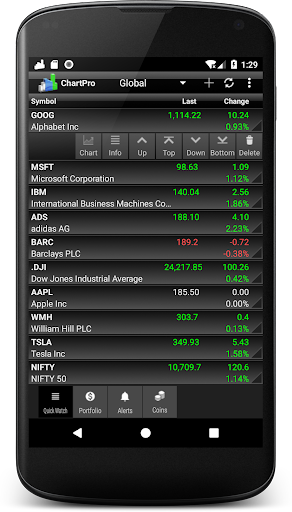


About this app
Developer Description
Professional interactive stock chart with portfolio tracking option.
Features of stock chart:
- Scrollable historical stock data
- Zoom in/out option
- Pinch to zoom
- Crosshair cursor
- Drawing tools
- About 50 technical indicators (Moving Averages, MACD, RSI, Parabolic SAR, Stochastic Oscillator, %R, Ichimoku etc)
- Line, Area, Candlestick, OHLC chart types
- Daily, Weekly, Monthly bar compression
- Offline mode
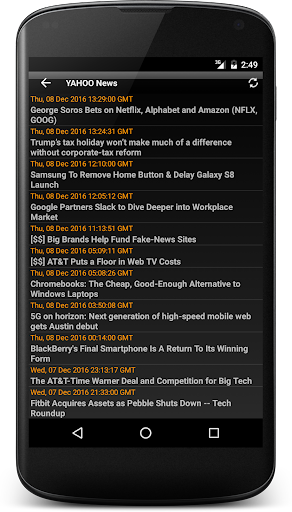
- News
- Alerts
- Chart themes
This application performs optional background data checks to trigger user alerts. You can disable this anytime in Settings.
Application also contains section for stocks portfolio. There you can track your personal finance: current profit/loss depending of purchasing price of underlying financial instrument. Stocks portfolio supports adding new transactions, managing existing transactions, adding dividends and splits. Value of portfolio is automatically calculated as latest quote data is downloaded from server, so you will have your real time personal finance. Opening of both short and long positions is supported by stocks portfolio.
Stock portfolio features:
- Opening both long and short positions
- Adding / Removing transactions
- Adding dividends
- Managing splits
- Opening stock chart directly from portfolio
- Stock details (52 high, 52 low etc)
- Multiple lists
- Symbol drag & drop
- Sorting of symbols
Because of stock chart that has integrated tools for technical analysis, application is suitable for users that want to do detailed research about stock they would like to invest in.
Application has also support for currencies, but because of limitations from free server chart for currency pairs doesn't support candlesticks and OHLC chart types.
Quick watch and stock portfolio screens are separated, so user can track values of stocks independently of stocks portfolio.
Most popular markets are supported like US, Canada, UK, Germany, Australia, India etc.
What's New
- Alerts can only run in background (no foreground option)
In-app purchases
$1.99 - $9.99 per item
Version Information
- Version
- 3.7.23
- Downloads
- 100K+
- Updated on
- Nov 8, 2025
- Released
- Feb 9, 2011
- Requires
- Android 8.0
Statistics
Google Play Rating History
Rating Distribution
Downloads Over Time
Professional Stock Chart has been downloaded times. Over the past 30 days, it averaged downloads per day.
Shaded area shows 30-day prediction based on historical trends
Historical data collection started recently. More data points will be available over time.
Professional Stock Chart - Google Play Rankings
Top Rankings
| Rank | Country | Category | List | Change |
|---|---|---|---|---|
| — |
Ranking History in
No ranking data available yet. Rankings are updated daily.
#92 in Top Grossing Finance in Thailand

Professional Stock Chart users say on Google Play
 Devin King
Great application, download immediately. I've been using it for years, second to none and absolutely must have app for traders/investors!
 Paul Springer
I like it a lot so far. It's the best charting app I've found in the play store. Some way to set indicators, globally, would be a huge improvement. Most people use the same basic indicators on all of their charts. Being able to apply some indicators to everything would be awesome.
 Narayanan VS
This is among the best Char reader, as well market news, but chart we could not add some more additional chart effects, only premium based, that is drawback us... Thanks to the Developer's team...
 fbg _
fbg _
Would hv 5 stars if following rectified: 1. Blue colour don't show up well on screens with low nits. U can hardly read the text with the blue, Dark blue is even worse. Better to have a sky blue 2. BUG= Am using Yahoo as the delayed prices to update. Don't know why but the vol shown is always double (2X) the actual vol traded for the day. Since vol is 📊 the relative bars are still OK 2USE. 3. X-axis time line hv fixed time frames. 4. Very few updates, only once a year.
 Fathan Nugroho
after use a year with satisfaction, on 24 September 2025 the price not moving at all. day chart and weekly chart have different price
ApkTrusted Ratings & Reviews
Scan this QR code to download

Forwarding you to the page at Google Play market in seconds...
Open Google Play market now