OHL Scanner- Intraday Traders v1.1.8.8
TECH-SITE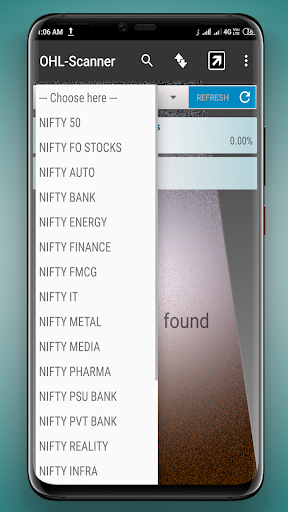
About this app
Developer Description
Why Open High Low Strategy (OHL) is so famous and easy!
The Entry and Exit details is explained step by step below
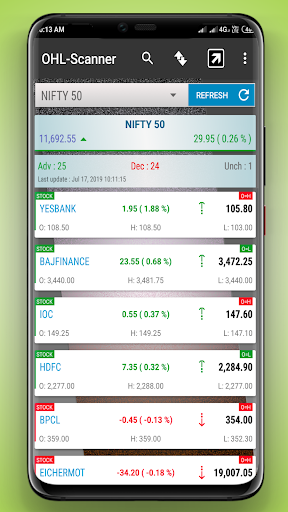
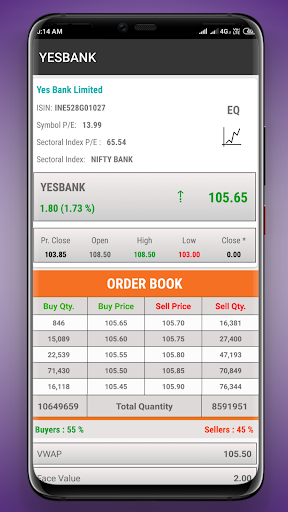
⇨ Here BUY signal is generated when OPEN = LOW (or Indicating O=L right side of Card view)
⇨ and SELL signal is generated when OPEN = HIGH (or Indicating O=H right side of Card view)
If a stock opens " Open = Low " and the weekly chart is also in up trend , You can goLong with confidence.
In the similar way if " Open = High " and the weekly chart is in down trend you can go short with confidence.
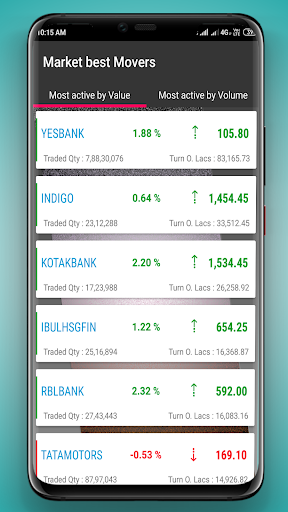
For Intraday trading choosing high liquid stocks for trading will help you Enter and Exit a trade very easily.
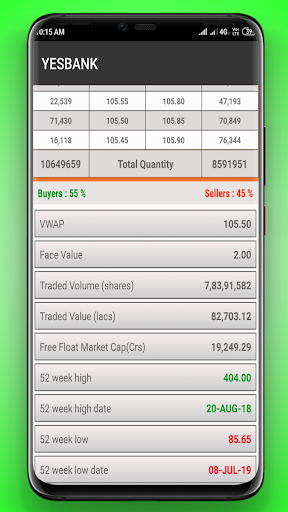
Example: When the volume is 5,00,000 above (see volume in stock details) the column turns green, Which indicates there is good liquidity and this will help you easily enter and exit trades.
For Buying Stock >> Open=Low with Weekly uptrend and Volume 5,00,000 and above.
For Selling Stock >> Open = High with Weekly downtrend and Volume 5,00,000 and above.
To be successful in Intraday trading having a tried and tested strategy is very important. The open high low strategy is one of the famous strategies which has high accuracy, many people use this strategy on a day to day basis.
Selecting stocks plays a major role in intraday trading, there are various strategies to select stocks for day trading The open high low strategy is one among them, the strategy is very simple and easy to understand.
Why Open High Low Strategy (OHL) is so famous and easy!
1. You can understand this strategy very easily and implement it in the next trading session.
2. No need for pre-day analysis, Yes! you save so much of time.
3. Selecting stocks becomes so easy,
You just have to know the trend/direction the market is headed Preferred, to run this strategy on at least 3 scrips so that if one fails other two will help you be in profit
Entry details:
1. Scan the stocks with Open=Low and Open=High when the market open from this scanner.
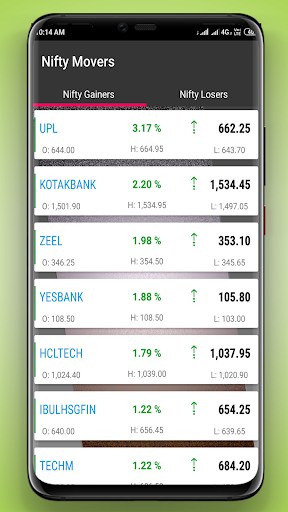
2. Wait till 9.30 A.M and analyze the overall market trend.
3. If the Nifty50 index is above 0.20% go on the buy side and if below 0.20% go on the sell side.
4. At 9:30 AM if the low/high is not broken, Buy/Sell stock according to the strategy.
5. Time frame 5 minutes candlestick preferred.
Exit details:
1.Keep target of 0.3 % or 0.5 % of the stock price for beginners, and if your an expert exit according to your technical analysis.
(For understanding, if the stock price is 250 then 0.3% of the stock price is calculated by multiplying 250 with 0.3%
Calculation of Target :
( 0.3 / 100 ) *Stock price
(0.3/100)*250 = 0.75 Rps.
If you had bought 200 stocks at the price 250, then the total profit you will obtain is 200*0.75 = 150 Rps.)
2. Stop Loss: It is preferred to keep SL at the open/close of the previous candle as stop loss, But the stop loss should never be more than 1% of the stock price. If its more than 1% dont take the trade.
What's New
In-app purchases
$0.99 - $37.99 per item
Version Information
- Version
- 1.1.8.8
- Downloads
- 50K+
- Updated on
- Jul 11, 2025
- Released
- Apr 21, 2019
- Requires
- Android 5.0
Statistics
Google Play Rating History
Rating Distribution
Downloads Over Time
OHL Scanner- Intraday Traders has been downloaded times. Over the past 30 days, it averaged downloads per day.
Shaded area shows 30-day prediction based on historical trends
Historical data collection started recently. More data points will be available over time.
OHL Scanner- Intraday Traders users say on Google Play
 Vinod Salian
I love this. It helps in finding OHL Stocks easily. Little ads appear it's OK.
 Yogesh Mate
Hi Team, You app is very good, but please change Or remove girl advertise. It's request. ( Itc ko buy krukya and etc...... Thank you..
 Gaddipati Prabhakar
Good
 prasenjit auddya
after update it is crash for some bugs
 Jayesh Sagar
No iOS app Its already more than a year but still awaiting iOS app, really disappointing
ApkTrusted Ratings & Reviews
More from TECH-SITE
See more apps


Scan this QR code to download

Forwarding you to the page at Google Play market in seconds...
Open Google Play market now