Debuggable Browser v1.3
David Pertiller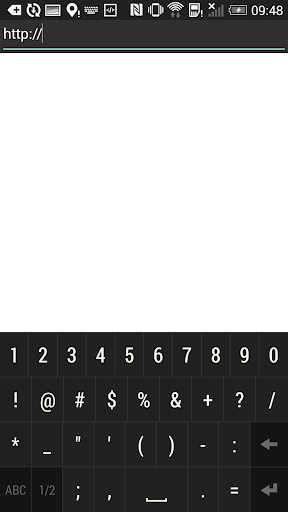

About this app
Developer Description
This browser allows you to inspect and debug any web page using Chrome DevTools
Just a debug-enabled WebView, allowing you to use Chrome's Developer Tools (running on your PC or Mac) to inspect and debug your web app while its running on your actual device.
Aimed only for web developers and web designers
This app was built for web developers who aim to deliver the best user experience of their web app to Android users. If you're not a web developer or web designer interested in debugging web apps, then you're likely better of with a normal browser ;)
What's the use of it?
If you ever opened your web site in the Android stock browser and encountered one of the following issues, this app might prove useful to you:
• The layout or styling of your web site appears broken when viewed in the Android stock browser
• Your JavaScript code didn't produce the expected result or the computation must have suddenly stopped during execution (maybe an exception was thrown?)
• Animations are laggy or just don't animate as expected
Description
It sometimes happens that a web app doesn't work on mobile browsers, even though it's working fine on desktop browsers. Even worse, sometimes defects occur only on (certain) mobile devices, so you cannot simulate and reproduce it on a desktop browser. This is where remote debugging with Chrome's DevTools proves to be useful. While Chrome for Android perfectly supports this already, the Android stock browser doesn't. This is unfortunate, since a lot of Android bugs seem to occur only on the stock browser and not on Chrome anyways.
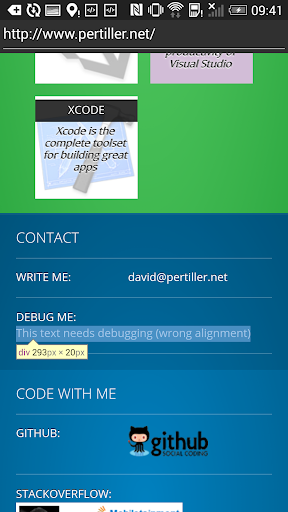
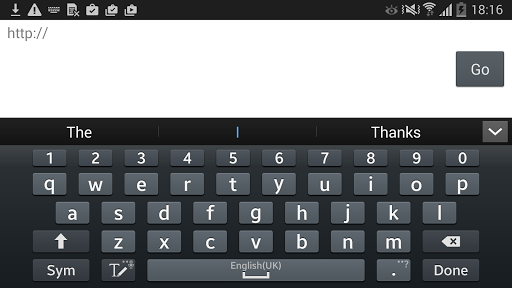
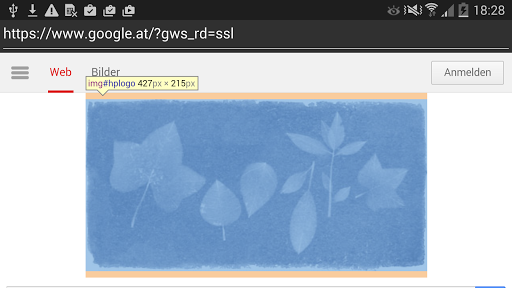
So this app lets you run web sites within the native browser (WebView), while giving you the possibility to inspect and debug the page with the Chrome DevTools.
How to start remote debugging?
1. Enable Developer Mode on your Android device and connect it to your PC/Mac
2. Open this app and navigate to your web site by entering its URL
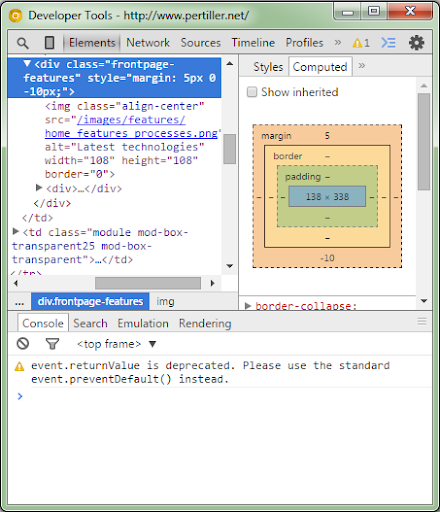
3. On your PC/Mac, open Chrome and type "chrome://inspect" into the address bar
4. In Chrome, check "Discover USB Devices" and it will list the web page you've opened on your device
5. Hit inspect and enjoy remote debugging the app with the Chrome Developer Tools
For more information, read: https://www.pertiller.tech/blog/remote-debugging-the-android-native-browser
What's New
- It's been exactly 1 year since the last release and I noticed that this app led to some confusion for a lot of people that misunderstood its use-case: it's built for web developers who want to optimize their web app with the power of Chrome's dev tools while running the page on an actual Android device (see updated notes).
- Besides, I got some lovely suggestions. So now you can start the app as intent from another app to start debugging a weblink right away!
Version Information
- Version
- 1.3
- Downloads
- 10K+
- Updated on
- Aug 14, 2016
- Released
- Mar 14, 2015
- Requires
- Android 4.4
Statistics
Google Play Rating History
Rating Distribution
Downloads Over Time
Debuggable Browser has been downloaded times. Over the past 30 days, it averaged downloads per day.
Shaded area shows 30-day prediction based on historical trends
Historical data collection started recently. More data points will be available over time.
Debuggable Browser users say on Google Play
 A Google user
This app does exactly what it is meant to, just people interpret it as a different kind of app, it is not meant to be an inspect element app, its meant to be connected to a computer for developers, so the terrible ratings are because people are thinking the app is for something else.
 Jayasree P
Ok. I got the usage. But can you integrate a dom view within the app so you can really inspect element within the debuggable browser
A Google user
Settings don't work and no tools available, at least couldn't figure out any...android 5, loads pages, but nothing more...I want a working console that can input js...
A Google user
Just a useless Browser only,😠😠😡🤬
ApkTrusted Ratings & Reviews
More from David Pertiller
See more apps


Scan this QR code to download

Forwarding you to the page at Google Play market in seconds...
Open Google Play market now