
Physics Toolbox Sensor Suite P v2024.10.06
Vieyra Software
About this app
Developer Description
Record, display, and export data from your smartphone's internal sensors.
Sensors, generators, and data analysis tools include the following:
KINEMATICS
G-Force Meter - ratio of Fn/Fg (x, y, z and/or total)
Linear Accelerometer – acceleration (x, y, and/or z)
Gyroscope - radial velocity (x, y, and/or z)
Inclinometer - azimuth, roll, pitch
Protractor - angle from vertical or horizontal
ACOUSTICS
Sound Meter - sound intensity
Tone Detector - frequency and musical tone
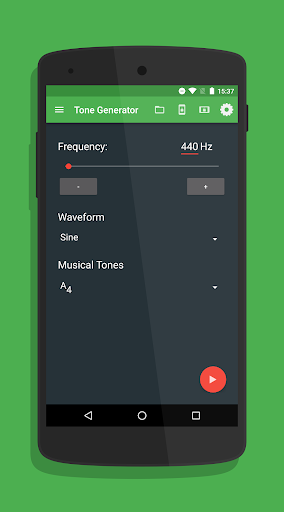
Tone Generator – sound frequency producer
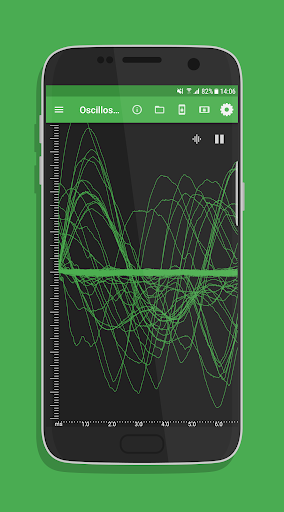
Oscilloscope - wave shape and relative amplitude
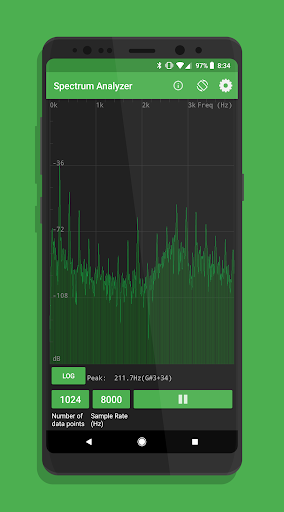
Spectrum Analyzer - graphical FFT
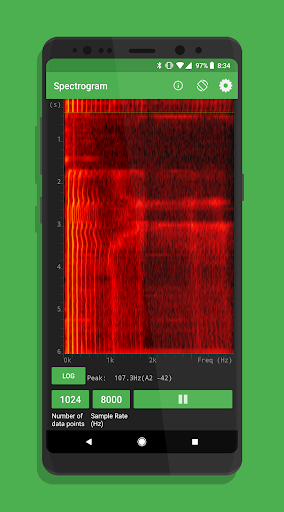
Spectrogram - waterfall FFT
LIGHT
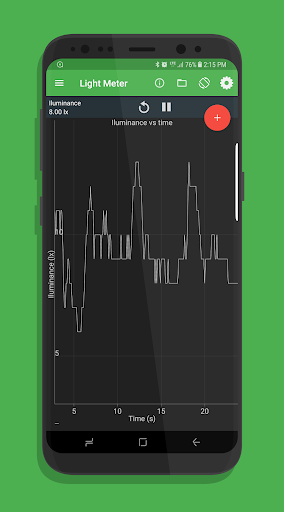
Light Meter - light intensity
Color Detector - detects HEX colors within a small rectangle area on the screen via the camera.
Color Generator – R/G/B/Y/C/M, white, and custom color screen
Proximeter - periodic motion and timer (timer and pendulum modes)
Stroboscope (beta) - camera flash
Wi-Fi - Wi-Fi signal strength
MAGNETISM
Compass - magnetic field direction and bubble level
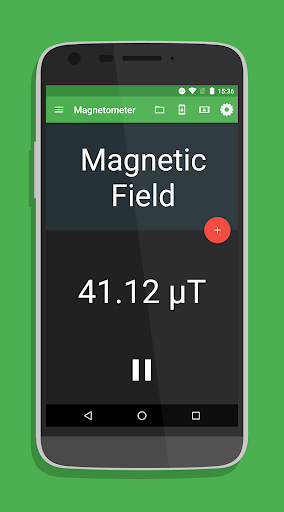
Magnetometer - magnetic field intensity (x, y, z and/or total)
Magna-AR - augmented reality visualization of magnetic field vectors
OTHER
Barometer - atmospheric pressure
Ruler - distance between two points
GPS - latitude, longitude, altitude, speed, direction, number of satellites
System Temperature - battery temperature
COMBINATION
Multi Record - choose one or more of the above sensors to collect data at the same time.
Dual Sensor - display data from two sensors on a graph in real time.
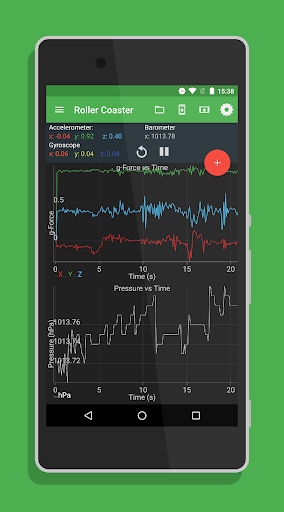
Roller Coaster - G-Force Meter, Linear Accelerometer, Gyroscope, and Barometer
PLOTTING
Manual Data Plot - enter data manually to generate a graph.
GAME
Play - challenges
FEATURES
(a) Record: Record by pressing the red floating action button. Find saved data stored in the folder icon.
(b) Export: Export data by selecting an option to send via e-mail or shared in Google Drive or Dropbox. Locally saved files can also be transferred from the folder icon.
(c) Sensor Information: Clicking on the (i) icon to identify sensor name, vendor, and current data collection rate, and to learn what kind of data is collected by the sensor, its physical operating principle, and links to additional resources.
SETTINGS
* Note that not all settings are available for all sensors.
(a) Data Display: View data in graphical, digital, or vector form.
(b) Graph Display: View multi-dimensional data sets on a single shared graph or in multiple individual graphs.
(c) Displayed Axis: For multi-dimensional data on a single shared graph, select total, x, y, and/or z-axis data.
(d) CSV Timestamp Format: Record clock time or elapsed time with sensor data.
(e) Line Width: Modify visual presentation of data with a Thin, Medium, or Thick line.
(f) Sensor Collection Rate: Set collection rate as Fastest, Game, UI, or Normal. The sensor collection rate is displayed for each option when selected.
(g) Keep the Screen On: Prevent the app from turning the screen off automatically.
(h) Calibrate: Calibrate selected sensors.
Version Information
- Version
- 2024.10.06
- Downloads
- 10K+
- Updated on
- Oct 6, 2024
- Released
- Mar 11, 2017
- Requires
- Android 7.0
Statistics
Google Play Rating History
Rating Distribution
Downloads Over Time
Physics Toolbox Sensor Suite P has been downloaded times. Over the past 30 days, it averaged downloads per day.
Shaded area shows 30-day prediction based on historical trends
Historical data collection started recently. More data points will be available over time.
Physics Toolbox Sensor Suite P - Google Play Rankings
Top Rankings
| Rank | Country | Category | List | Change |
|---|---|---|---|---|
| — |
Ranking History in
No ranking data available yet. Rankings are updated daily.
#28 in Top Paid Tools in United States
 Screen Mirroring + for Fire TV
Physics Toolbox Sensor Suite P
Screen Mirroring + for Fire TV
Physics Toolbox Sensor Suite P
 WiFi Signal Strength Meter Pro
#22 in Top Paid Tools in United Kingdom


Physics Toolbox Sensor Suite P users say on Google Play
 Ira Fellows
This application is great. I originally installed this to help illustrate to my 6yo daughter that everything that we perceive around us (sounds, light, vibrations, etc) can be detected and measured with the right equipment. She's enjoying it quite a bit. The data visualizations are very effective and not cluttered with unnecessary UI elements. I also imagine it'll be useful to introduce new mathematical concepts as well, like log scales and (some day 🙂) Fourier transformations.
 Shinn Choo
Useful app overall but there are some odd quirks especially with the magnetometer function. Was having a high baseline reading even though all magnets have been removed from the area. Restarting the app seems to drop it back to approximate 0.4G.
 Mathias Lundgren
The GUI is inconsistent (eg. no back button on all pages) and when using modes not functioning on my model i get no feedback that this is the case.
 John Mikel
It worked satisfactory on most functions except tone detector. Now, since a recent Android update, it doesn't detect sound.
 pubudu madusanka
Best application
ApkTrusted Ratings & Reviews
More from Vieyra Software
See more apps
Similar Apps


Scan this QR code to download

Forwarding you to the page at Google Play market in seconds...
Open Google Play market now