
G-NetView Pro vVARY
GyokovSolutions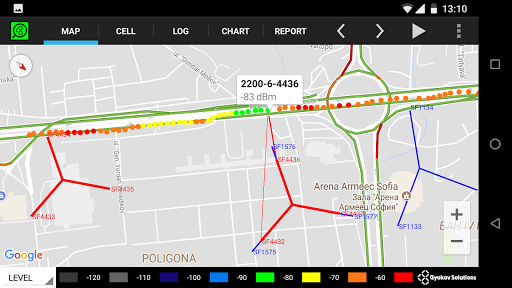


About this app
Developer Description
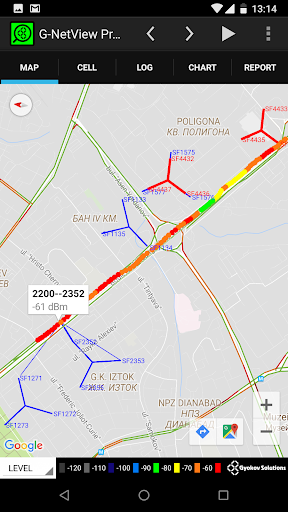
G-NetView Pro is an app for post processing and analyzing G-NetTrack logfiles.
This is one-time payment app. There are no monthly fees.
Features:
- logfile points visualization on map
- serving and neighbor cell lines visualization
- different thematic maps - LEVEL, QUAL, CELL, TECH, PCI/PSC/BSIC, SNR, BITRATE, SPEED, ALTITUDE, SERVING DISTANCE, SERVING BEARING, SERVING ANTENNA HEIGHT, ARFCN, TEST PING, TEST BITRATES, NEIGHBORS LEVEL, NEIGHBORS QUAL
- measurement point info
- measurements charts
- measurements histogram statistics charts
- export of measurement charts and statistics in html format to be viewed on desktop browser
- logfile player
- floorplan load for indoor measurements
IMPORTANT: Please note that to visualize serving and neighbors cell you need to load cellfile with cell locations. There is no magical way to guess exact cell locations.
How to use:
1. Load site data - the sites are loaded from cellfile.txt that is in folder G-NetView/celldata. Put your cellfile in this folder. On app install there is a sample cellfile.
2. Load logfile - select your text logfile to open it. In folder G-NetView/celldata there is a sample test_logfile.txt.
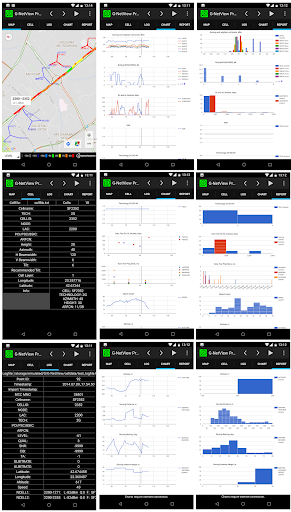
3. Use buttons to play logfile or select a point to see measurements.
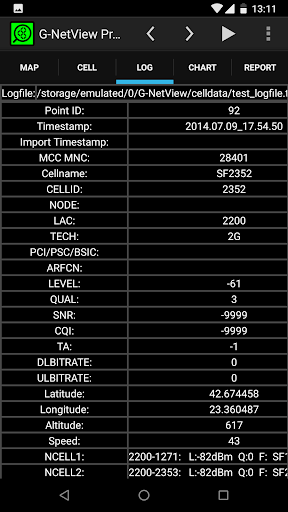
4. In LOG tab you can see measurements for selected point.
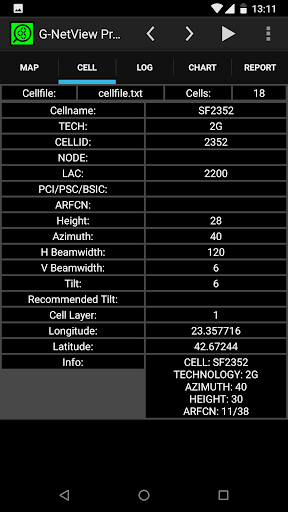
5. In CELL tab you can view information for serving or manually selected cell.
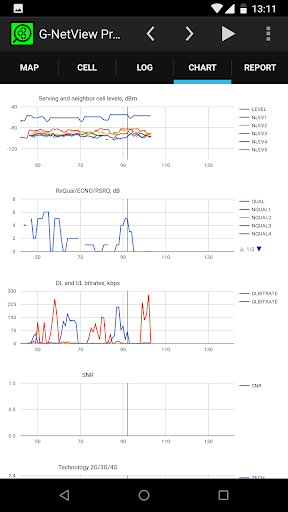
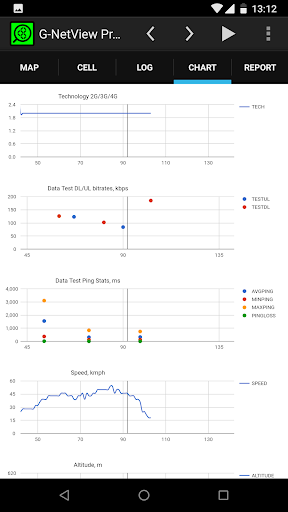
6. In CHART tab you can view the measurement charts. Use buttons to move or zoom.
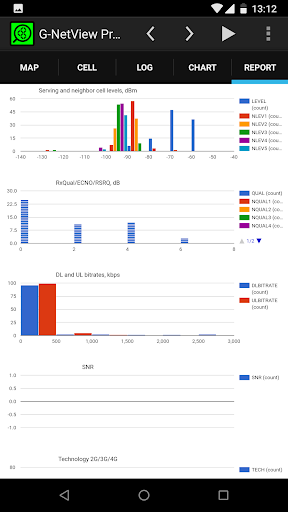
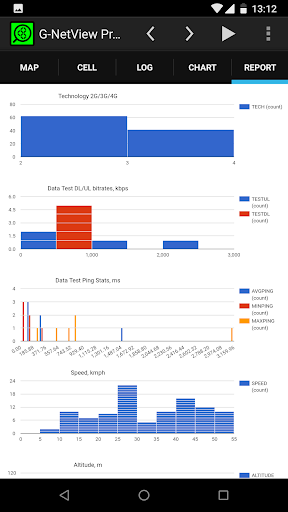
7. In REPORT tab you can see the measurement statistics charts.
Version Information
- Version
- -
- Downloads
- 500+
- Updated on
- -
- Released
- Jan 4, 2018
- Requires
- Android Varies with device
Statistics
Google Play Rating History
Rating Distribution
Downloads Over Time
G-NetView Pro has been downloaded times. Over the past 30 days, it averaged downloads per day.
Shaded area shows 30-day prediction based on historical trends
Historical data collection started recently. More data points will be available over time.
ApkTrusted Ratings & Reviews
More from GyokovSolutions
See more apps
G-NetWiFi
Free
Morse Code Engineer
Free

G-NetTrack Lite
Free

G-NetTrack Pro
Paid

Melody Engineer
Paid

Drums Engineer
Paid

GIF Engineer Pro
Paid

G-NetLook Pro
Paid

G-NetReport Pro
Paid

GIF Engineer
Free

BLE MIDI Engineer Lite
Free
G-NetWiFi Pro
Paid
Bass Engineer
Paid

BLE MIDI Engineer
Free

Morse Code Engineer Lite
Free
Morse Code Engineer Pro
Paid
Scan this QR code to download

Forwarding you to the page at Google Play market in seconds...
Open Google Play market now